


COMPANY · FIGURES AND TRENDS
Company metrics at Krückemeyer GmbH
The charts show how Krückemeyer GmbH’s creditworthiness, revenue, workforce and trainee numbers have developed. Each trend is labelled with the latest year covered by its chart.
01
FIGURES IN CONTEXT
Historical trends with clear reference years
Four charts trace the development of Krückemeyer GmbH’s creditworthiness, revenue, employee numbers and trainee numbers. They show historical annual figures rather than figures updated continuously.
The creditworthiness and revenue charts extend to 2024. The charts for employees and trainees end in 2023. The reference year shown on each chart is therefore essential when interpreting an individual metric.
02
COMPANY METRICS OVER TIME
-
2025
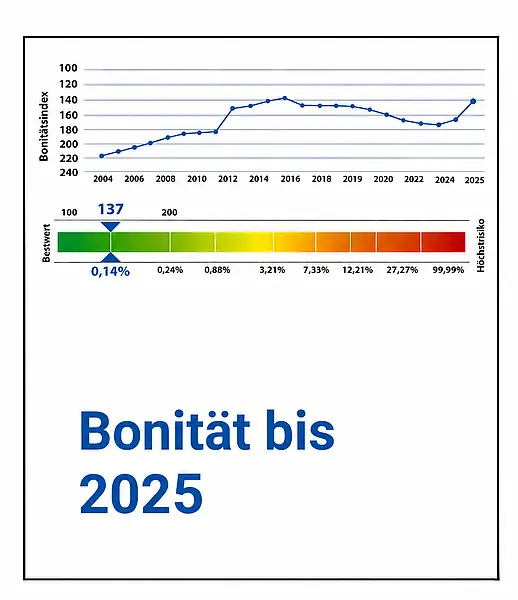
Creditworthiness
The chart shows the creditworthiness index from 2004 to 2025. A colour scale places the values between the best rating and the highest risk.
-
2025
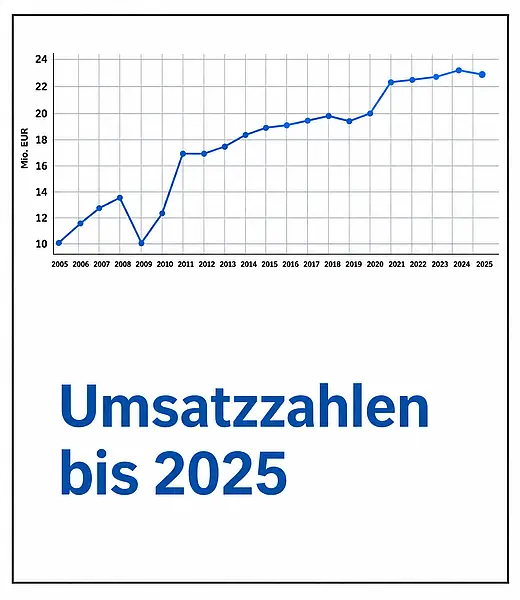
Revenue
The revenue chart plots annual figures from 2005 to 2025 in millions of euros. The points connect the individual years to show the trend.
-
2025
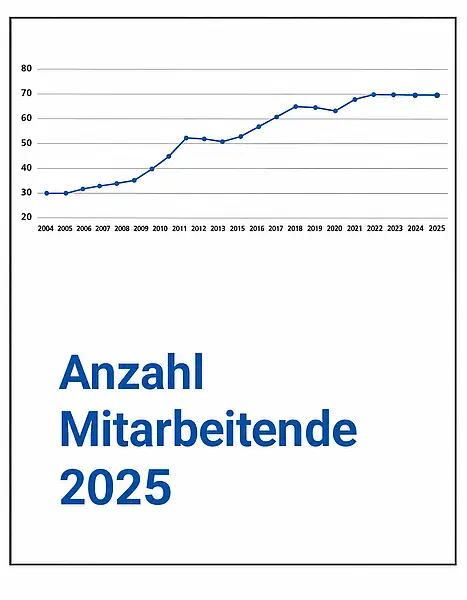
Employee numbers
The chart shows the number of employees from 2004 to 2025. The last year shown is 2025.
Questions about our company metrics?
Contact us if you would like to discuss a particular year or the company’s certifications.

Product consultation
Thomas Klein
Contact for products
Talk to Thomas Klein about your requirements and the right product.